


With New Jersey’s election data now available on L2, HaystaqDNA has conducted a post-election analysis to explore shifting voter behavior in the state. This analysis examines demographics, income/education data, turnout, and voter sentiment on five key subjects. The results in New Jersey demonstrate how voter dynamics have shifted and what this means for future elections.In the 2024 presidential election, the state witnessed a significant rightward shift. Traditionally a Democratic bastion, the narrowing margin between parties underscores changing dynamics and political trends seen across the country.
In 2020, Joe Biden won New Jersey with 57.33% of the vote compared to Donald Trump’s 41.4%, creating a gap of nearly 16 percentage points. Four years later, Kamala Harris secured victory with 51.8% (2,220,713 votes) against Trump’s 45.9% (1,968,215 votes), reducing the gap to just 5.9 percentage points. This marks a 4.5-point improvement for Trump compared to his 2020 performance in the state. But how does this change reflect across different interest groups?By analyzing voting clusters, which categorize individuals into six major voter segments, we have tracked the shifts in voter behavior over the past four years.
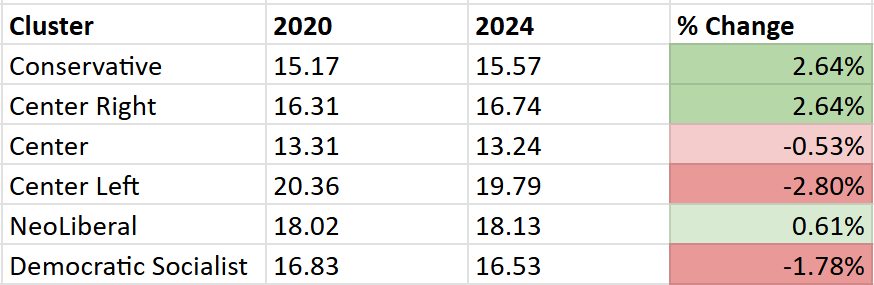
Key Insights:The number of registered voters grew by 881,366 from 2020 to 2024 but voter turnout was down nearly 10%. Only 61,829 more people voted in 2024 than 2020Shift from Absentee to In-Person Voting post Covid-19Number of registered Democrats decreased by 12,524 while GOP registration grew by 43,134Democrats were more likely to stay home; Dems who didn’t vote increased by 269,243 from 2020 suggesting lower voter enthusiasmConservative and Center Right clusters experienced modest growth (both +2.64%). While the Neoliberal cluster also saw gains.Center Left and Democratic Socialist saw the largest % decrease among the groups.Republican gains in New Jersey are part of a broader national trend of shifting voter alignments.While other racial groups maintained or increased turnout, Black voters were the only racial group that saw a decrease in the number of people casting ballots.Unlike the overall decline in turnout, older voters increased their participation in 2024 compared to 2020.Nearly 100,000 fewer college and grad school students voted in 2024 compared to 2020, contributing to the overall turnout drop.

HaystaqDNA’s post-election reports are tailor-made to fit the audience you are trying to reach. Combine any of our hundreds of scores with voting audiences to uncover how they break down and what drives their choices. This analysis was broken down into congressional districts, but it can also be adapted to any form of geography, such as counties, cities, towns, or villages to gain a more localized perspective on voter sentiment.HaystaqDNA’s expertise in post-election analytics can help you navigate these changes and uncover actionable insights. Reach out to learn how our tailored solutions can inform your next steps.
