





Get a free DataMapping Trial today and try these reports: https://l2-data.com/free-trial/
Quick Read Reports: PDF, CSV, and JSON
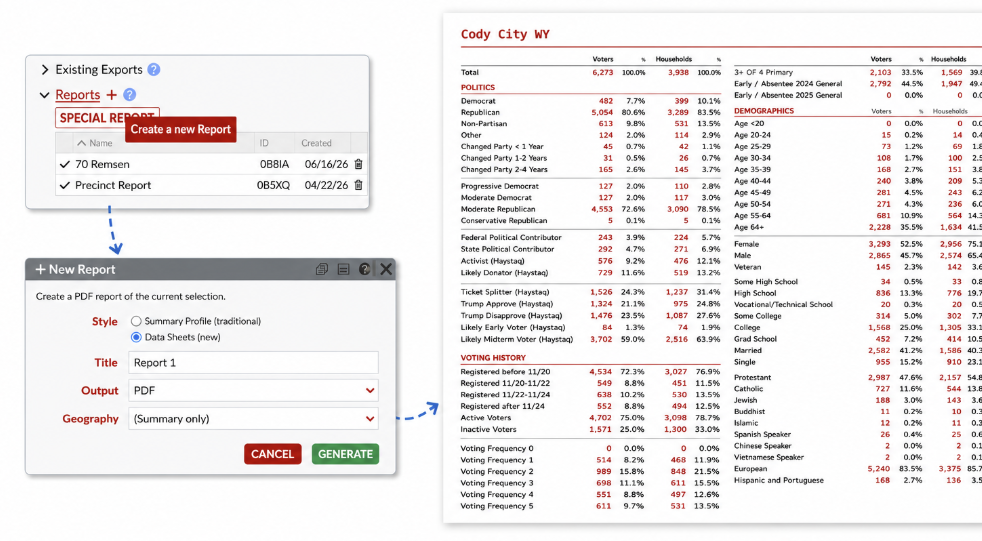
Get a fast, easy-to-read overview of any selected audience, geography, or district with L2’s new Quick Read Report. Designed to make complex data immediately usable, the report brings together key information from your selection in one clear, shareable format.
Quick Read Reports can summarize vote history, donor activity, demographic characteristics, registration and turnout patterns, and other relevant data points based on the audience or district you select. Whether you are preparing for a client meeting, evaluating a potential target area, reviewing a district, or sharing a quick snapshot with colleagues, the report provides an efficient way to understand the makeup of an audience without building a full custom analysis.
To generate a report, simply make your selection in DataMapping, navigate to the Reports section, and choose PDF Report, CSV Report, or JSON Report. PDF reports are ideal for presentation and sharing, while CSV and JSON options make it easy to incorporate the same information into internal analysis, reporting workflows, or other systems.
Election Results Spreadsheet Selection
L2’s industry-leading spreadsheet tool is now even more flexible for vote-history analysis and reporting. Users can now choose exactly which elections to include in a spreadsheet, giving them greater control over the results they analyze, compare, and share.
The updated tool also allows voter participation to be displayed either as rows or columns. This makes it easier to review individual voter histories, compare turnout across selected elections, identify patterns among key audiences, and create reports tailored to a specific campaign, research, advocacy, or analytical use case.
Rather than relying on a fixed set of elections or a standard output format, users can build a spreadsheet around the contests that matter most, from recent primaries and general elections to longer-term turnout trends. The result is a more customizable and practical way to evaluate participation history and turn L2 data into usable analysis.